
Point By Point:
Paul Cameron's Footprint
And Another Stab At The “Homosexual Lifespan”
Jim Burroway
April 9, 2007
Another “homosexual lifespan" study has hit the news. According to a flurry of press releases making rounds, married gays in Scandinavia die 24 years younger than everyone else:
Married Gays Die 24 Years Younger
Researchers Paul and Kirk Cameron reported at the Eastern Psychological Association convention that married gays and lesbians lived about 24 fewer years than their married heterosexual counterparts.1
Gays Die Sooner: Implications for Adoption
“The life span of gays is 20-plus years shorter than the life span of heterosexuals,” states Dr. Paul Cameron of the Family Research Institute, a Colorado-based think tank. “This shortened lifespan,” he warned, “has profound implications for adoption.”2
Discrimination Doesn’t Drive Gays To An Early Grave
Dr. Paul Cameron, of the Family Research Institute, a Colorado-based think tank, said “there was essentially no difference between the average age of death for homosexuals in accepting societies — Norway and Denmark — and the United States, which, according to gay rights activists, is still ‘a homophobic society’ since it still bans them from the military and giving blood.”3
Homosexuality More Dangerous Than Smoking
Studies have shown that years of smoking shortens the lifespan of the smoker from 1 to 7 years. But analysis of the age of death in Norway and Denmark for gays who are legally married suggests that engaging in homosexual behavior reduces the lifespan by 24 years!4
These statements refer to a new paper from the Family Research Institute’s Dr. Paul Cameron, “Federal Distortion of Homosexual Footprint,” co-authored by his son, Kirk Cameron. 5 According to these press releases, Paul Cameron presented this paper at the Eastern Psychological Association’s convention in Philadelphia on March 23, 2007.
Eastern Psychological Association Responds To CameronOn April 4th, I contacted the Eastern Psychological Association and asked then for a response to Cameron’s claims for having presented his paper at the convention in March. The EPA was surprised to learn about it. On April 11, Dr. Phil Hineline, President of the EPA, responded to my request for a statement. You can read the Eastern Psychological Association's Statement in its entirety. This isn’t the first time Paul Cameron has hijacked the reputation of a reputable organization or professional journal. It was just a year ago when he hoodwinked the Cambridge University Press’ Journal of Biosocial Science into publishing his bogus research. You can learn more about that in “Paul Cameron Conquers Cambridge.” Unfortunately, it’s been a full year, and the Journal of Biosocial Science has yet to respond. |
At least that’s what his press releases would have you believe. They describe “a report he gave at the Eastern Psychological Association convention at its annual meeting in Philadelphia.”6 Having read that, you’d think he spoke before the convention about his report, wouldn’t you?
Well if you did you’d be wrong. He didn’t speak at the convention, and he didn’t present a report. He participated in a poster session. And what is a poster session? Well, it’s just what it sounds like: a chance for participants to summarize their research findings on a poster displayed in a hall or conference room. People can enter, walk around, look at all the posters — there were sixty-six of them in this eighty minute session — ask a few questions, and move on to the next poster. That’s it. But it’s just enough of a cover for Cameron to hijack the reputation of the Eastern Psychological Association to enhance his usual bag of tricks.
|
You can learn more about how Paul Cameron’s history of deliberate misrepresentations got him in trouble with the psychological and sociological professions in “Paul Cameron vs. Professional Ethics.” |
And it turns out the general public aren’t the only ones being hoodwinked by Cameron’s latest escapade. He also managed to put the real thrust of his paper past the EPA. He disguised his research as a study on the prevalence of homosexuality, not as the homosexual lifespan study that he’s bragging about in his press releases. The official abstract on the EPA’s web site looks almost nothing like the much longer abstract in his paper.7 He essentially pulled a bait-and-switch at the EPA, and then used the EPA’s apparent stamp of approval to tout a different set of conclusions to the rest of the public.
He’s written six other papers on the “homosexual lifespsan” before this one, including his debut effort which, ironically, was presented at the Eastern Psychological Association in 1993.8 Now he returns to that same scene of the crime for his latest efforts.
I’d be tempted to say that it doesn’t get much worse than that. But of course, you know the story doesn’t end there. After all, it would be very significant news if he could prove that gays and lesbians were really dying at alarmingly young ages in Denmark and Norway, wouldn’t it? He also uses statistics from Canada and the United States to further buttress his arguments. Cameron’s findings have already caught conservative pundit Armstrong Williams’ attention. He saw one of Cameron’s press releases and asked, “Considering these statistics, do you now believe that vulnerable children should be raised in such an unstable environment?”9
“Considering these statistics,” Williams began his question. Yes, well let’s do that. We’ll consider each of these statistics, one by one, and see what’s up.
The Canadian Sample
Remember, Cameron’s paper is ostensibly about governmental bureaucratic “exaggeration” of the percentage of gays and lesbians in the population. And that’s how the paper begins. He first presents findings from the 2003 release of Cycle 2.1 of the Canadian Community Health Survey. Statistics Canada announced that this survey showed that 1.7% of all Canadians between the ages of 18 and 59 consider themselves to be homosexual or bisexual. Cameron complains that by ignoring the older population, this represents a significant overestimation of gays, lesbians and bisexuals in Canada. To try to prove his point, he requested a customized data set from Statistics Canada, which he presented this way:
| Age | Number of Respondents | Heterosexual | Homosexual/ Bisexual |
Unknown |
|---|---|---|---|---|
| 18-24 | 11,335 | 92.85% | 1.96% | 5.2% |
| 25-34 | 19,204 | 92.96% | 1.96% | 5.1% |
| 35-44 | 21,269 | 92.79% | 1.96% | 5.3% |
| 45-54 | 21,282 | 93.04% | 1.32 | 5.6% |
| 55-64 | 19,538 | 92.56% | 0.85 | 6.6% |
| 65+ | 28,672 | 86.25% | 0.37 | 13.4% |
| Note: Unknown= refused to answer or answered “don’t know.” | ||||
Referring to this data, he writes:
When older adults (age 60+) are included in the tallies of sexual orientation, the weighted fraction of the 121,300 respondents answering “homosexual” or “bisexual” drops to 1.43% (1.25% of women, 1.61% of men) — 16% smaller than the 1.7% figure originally reported.
But there are several problems with this data. First of all, notice the number of “unknowns” for all ages. This figure is significantly higher than the figure answering “homosexual” or “bisexual” for all age groups. Why is that? We don’t know. But we do know that when a straight person is asked about his or her sexual orientation, there’s little hesitance to simply checking off the “heterosexual” box. It’s one of the easiest questions for a straight person to answer — and for most it’s one of the most eagerly-given answers one can ask for. (“Hell, yeah — I’m straight!”) And yet in this survey we find about 7% of respondents who either didn’t want to answer the question or didn’t know.
Why the hesitancy? We don’t know exactly, but “unknown” would certainly be an odd answer for those whose answer might otherwise align themselves with more than 90% of his neighbors. And we also know that there are significant pressures particularly on older gays and lesbians to conceal their sexual orientation. Researchers have long noted significant differences in the willingness of older generations to identify themselves as gay, lesbian or bisexual.10 And even those who had been out all their lives often find themselves having to go back into the closet for fear of discrimination in retirement and other health care facilities.11 These are among the many likely explanations for the significant increase for the number of “unknowns” among the older members of the sample population.
But regardless of the explanation, when the total number of “unknowns” outnumber the number of self-acknowledged gays, lesbians and bisexuals by a factor of six, this high level of uncertainty calls into serious question the accuracy of the much lower number.
There are, of course, other issues, which Statistics Canada themselves are quick to point out:
Several concepts can be used to measure sexual orientation. These include behaviour, that is, whether a person’s partner or partners are of the same or the opposite sex, and identity, that is, whether a person considers himself or herself to be heterosexual, homosexual or bisexual.
The CCHS uses the concept of identity. Data from other countries suggest that the number of people who consider themselves to be homosexual is much smaller than the number who report having had sexual relations with someone of the same sex. However, people are more willing to answer questions about identity than about behaviour.12
Statistics Canada understood that by framing their questionnaire the way they did, they would get a lower answer. But they chose to frame their question based on identity rather than behavior anyway, hoping to reduce the number of unknowns in the results. But given the high number of unknowns that made it into the final results anyway, it doesn’t look like this strategy was necessarily all that successful.
The Danish and Norwegian Samples
This of course, doesn’t deter Cameron. He already has a different answer for the lower proportion of gays, lesbians and bisexuals in the older population: “their earlier demise.” To support that, he turns to data from Denmark and Norway:
Statistics Denmark and Statistics Norway publish official population cross-tabulations of marital status by age for each sex in their annual statistical yearbooks. Since 1994 in Denmark and 1995 in Norway, these tables have included separate categories for homosexual-partnered individuals. We obtained these data sets and also purchased non-publicly available data from Denmark and Norway on age-at-death cross-classified by sex and marital status. Statistics Norway provided such data for the years 1997 through 2002, including a category for those who died who were ever homosexually-partnered. Statistics Denmark provided similar data for the years 1990 through 2002.
Dr. Cameron summarizes the data he obtained this way:
| DENMARK | Number of Deaths | Life Expectancy At Birth | Standard Error (years) | LCL (years) | UCL (years) |
|---|---|---|---|---|---|
| Men, All | 387,569 | 71.8 | 0.026 | 71.75 | 71.85 |
| Men, Ever-Married | 333,336 | 74.4 | 0.021 | 74.32 | 74.40 |
| Men, Ever-Partnered | 561 | 51.2 | 0.647 | 49.92 | 52.46 |
| Women, All | 394,301 | 77.5 | 0.024 | 77.46 | 77.56 |
| Women, Ever-Married | 353,483 | 78.3 | 0.021 | 78.29 | 78.38 |
| Women, Ever-Partnered | 91 | 55.8 | 1.538 | 52.79 | 58.82 |
| LCL: 95% lower confidence limit; UCL: 95% upper confidence limit. Life Expectancy: —All: Official death tallies over 1990-2002 —Ever-married: Official death tallies of married, widowed, separated and divorced individuals —Ever-partnered: Official death tallies of registered same-sex partners, widowed partners, and dissolved partners. |
|||||
| NORWAY | Number of Deaths | Life Expectancy At Birth | Standard Error (years) | LCL (years) | UCL (years) |
|---|---|---|---|---|---|
| Men, All | 132,082 | 73.8 | 0.045 | 73.67 | 73.85 |
| Men, Ever-Married | 110,031 | 76.5 | 0.036 | 76.46 | 76.60 |
| Men, Ever Partnered | 31 | 51.7 | 2.156 | 47.50 | 55.96 |
| Women, All | 134,825 | 80.0 | 0.039 | 79.95 | 80.10 |
| Women, Ever-Married | 117,833 | 80.9 | 0.034 | 80.81 | 80.94 |
| Women, Ever-Partnered | 6 | 56.4 | 5.657 | 45.29 | 67.57 |
| LCL: 95% lower confidence limit; UCL: 95% upper confidence limit. Life Expectancy: —All: Official death tallies over 1997-2002 —Ever-married: Official death tallies of married, widowed, separated and divorced individuals —Ever-partnered: Official death tallies of registered same-sex partners, widowed partners, and dissolved partners. |
|||||
At first blush, this data doesn’t look good for gays and lesbians does it? What’s more, the data by themselves meet all of the standard statistical measures for significance.
But statistical significance only applies when there is a sound logic behind the data. And this is where Cameron’s methodology falls apart. Notice the numbers of deaths of those who were in same-sex partnerships. They’re quite low — only 652 for Denmark and a scant 37 from Norway. That means only 0.01% of all Norwegian deaths are of those who were in same-sex partnerships. The figure rises to just 0.07% for Denmark.
Why are these figures so small? If homosexuality had such a terrible effect on gay lifespan, you’d think they’d be dropping like flies. But as is the case with Cameron’s “statistics,” there is always much more than meets the eye. And the first question we need to ask is how old are the living registered partners overall? Fortunately, we have two different ways of looking at it, and both of them are available online for Denmark, which happens to be the larger of Cameron’s sample.
So let’s look at Denmark first because their available data is much more detailed. And let’s begin by looking at the ages of men and women when they enter registered partnerships:13
| MEN | 1999 | 2000 | 2001 | 2002 | 2003 | 2004 | 2005 |
|---|---|---|---|---|---|---|---|
| Under 30 | 68 | 76 | 66 | 53 | 50 | 50 | 69 |
| 30-39 | 121 | 132 | 140 | 111 | 105 | 102 | 132 |
| 40-49 | 54 | 59 | 70 | 52 | 60 | 57 | 76 |
| 50+ | 59 | 63 | 54 | 49 | 66 | 47 | 53 |
| % Under 40 | 63% | 63% | 62% | 62% | 55% | 59% | 61% |
| WOMEN | 1999 | 2000 | 2001 | 2002 | 2003 | 2004 | 2005 |
|---|---|---|---|---|---|---|---|
| Under 30 | 63 | 60 | 76 | 100 | 93 | 85 | 197 |
| 30-39 | 139 | 111 | 149 | 132 | 145 | 168 | 175 |
| 40-49 | 54 | 60 | 72 | 48 | 72 | 95 | 88 |
| 50+ | 20 | 28 | 36 | 45 | 33 | 48 | 61 |
| % Under 40 | 71% | 66% | 68% | 71% | 69% | 64% | 65% |
Statistics Denmark doesn’t post enough information online to calculate average ages of those who enter into registered partnerships, but we can see that the median age for gays and lesbians is well below forty. The average is likely to be somewhat under forty as well. William Eskridge, Jr. and Darren Spedale reviewed a larger data set from Denmark than the one currently online, and they observed that the average age was under forty and “the age of entry into registered partnership has been relatively constant since 1989.”14 In other words, there was no rush of older gays and lesbians to register their partnerships when the law was first enacted.
Why is this important? The heterosexual sample has been accumulating under-forties for an entire century. (In 2005, the average age of the groom was 37.4 years; for the bride, 34.7 years.15) But registered same-sex partnerships have only been available in Denmark since 1989, which means the gay sample got a late start. And if the typical age of someone entering into a same-sex partnership is around forty, then it stands to reason that the typical age at death of someone who has died so far would be similarly young.
Those who have died after only 18 years haven’t had a chance to grow old. Thirty- to thirty-nine-year-olds in 1989 are only forty-eight to fifty-seven years old today — well within the range of Cameron’s “age of demise.” And those forty-year-olds in 1989 have been followed by several hundred more 30-39 year olds since then, further diluting the average age of those in this rather small pool downward.
In other words, Cameron’s sample only captured those who died so far, out of a sample that continues to live and grow older without dying.
And other population data from Denmark bears this out. We can look at the overall ages of everyone in Denmark who has ever entered into a registered partnership and compare it to the ages of heterosexually married couples. When we do this, the age distributions between 1999 and 2005 look like this:16
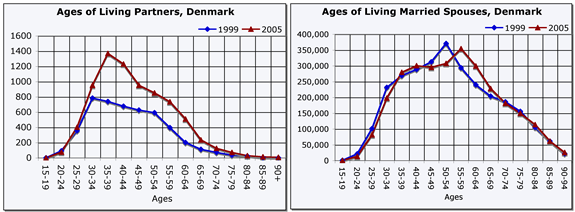
As you can see, the total population of partnered Danes has not only grown, but the overall age distribution has gotten noticeably older. As these Danes have grown older from 1999 to 2005 and more gays and lesbians (most of whom were under forty) continued to enter the pool of registered partners, the average age of the total sample went up by more than 1.65% over those five years.
Meanwhile, the change in the average age of those who are heterosexually married is much smaller over the same period. We can see the post-war bump enter their late fifties and early sixties, and we can also see the effects of Danes waiting longer before marrying among Danes in their twenties and early thirties. But overall, the age distribution isn’t changing all that much. In fact, the average age of all Danes who have ever been married increased by only 0.95 years between 1999 and 2005, largely on the strength of the post-war bump getting six years older.
In other words, the average age of heterosexually-married Danes is increasing at a rate that is 42% slower than that of gay and lesbian registered partners. If gays and lesbians were dying off at alarmingly young ages, we should see the opposite occurring. But we don’t. The only reason Cameron sees such a relatively young age among registered gay Danes is that there are so few older partnered Danes available to wind up in his data set when they die off.
Data from Statistics Norway are harder to come by online. But Norway’s Statistical Yearbooks are available from 1996 to 2005. That data looks like this:17
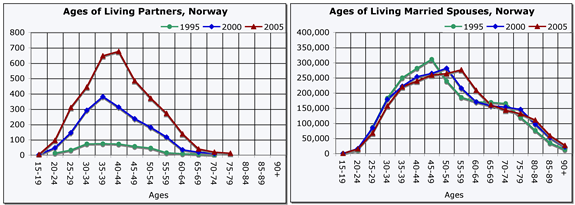
We can see a similar trend with Norway as we did with Denmark. But we should remember that registered partnerships didn’t begin in Norway until 1993, so the number of registered partners in Norway is significant smaller than in Denmark. Also, we can see that Norway appears to have experienced a much larger post-war baby boom than Denmark. But it appears generally that the same trends we saw in the Denmark data are repeating themselves in Norway.
Cameron’s Danish and Norwegian statistics show an average age at death in the fifties for registered partners simply because there aren’t many older partners in those samples to begin with. And the reason they aren’t in that sample is because for whatever reason, they haven’t registered their partnerships. Cameron dismisses the idea that homophobia is a major factor in Scandinavia because “Canada, Norway, and Denmark are far more accepting of homosexual practitioners than the United States (where homosexuals are still barred from the military and ‘gay rights’ laws do not exist in most states).” But saying that homophobia is lower in Scandinavia isn’t the same as saying it doesn’t exist. For example, it is still illegal in Denmark for gay couples to adopt children except for the children of their registered partners.18 And homosexuality is still not acceptable among many Danes and Norwegians, particularly among those living in rural areas and among the older generations — precisely the populations that haven’t availed themselves of registered partnerships.19
Cameron’s paper also displays a significant omission. I showed you the trend in overall ages of the registered population in Denmark and Norway. Despite the continued entry of under-forties into that sample, the population continues to get older overall. What about Cameron’s “age at demise” data? If you broke down his data into annual averages, would it show a similar trend? We don’t know. He only gives a single lump sum spanning more than a decade. But if the age of the sample population is increasing over time, it stands to reason that the average age of death is also increasing over time.
But as it stands, Cameron’s fatal flaw in his logic is that he’s only looking at those who died from a very limited data set. His methodology doesn’t account for those who continue to survive towards ever older ages.
The US Sample
After presenting the Canadian, Danish and Norwegian data, Dr. Cameron then tries to compare it to an updated version of his own U.S. obituary study. By looking over obituary data from the Washington Blade (which does not publish a regular obituary section equivalent to those found in general distribution papers), Cameron claims that American gay men die at an average age of 45.2 years. Lesbians supposedly die at an average age of 54.8 years.
It’s fitting that Cameron would conlcude his life-expectancy presentation on this note as it brings him full circle. It was at another Eastern Psychological Association convention in 1993 that he presented his first “gay obituary” study.20 But his latest incarnation is no more sound than his first one. And by relying on the Blade for his updated analysis, his efforts fall victim to several egregious weaknesses. For example:
- The gay press is largely urban, and generally doesn’t cover rural areas.
- The Blade doesn’t have a general community obituary section. The obituaries they cover are mostly limited to the more well-known members of the local community or prominent national figures. Many gay newspapers do not accept obituaries about just anyone unless they are likely to be known among its readers.
- And even if they did, surviving family members arn’t likely to be aware of the gay press, and they may not think to place an obituary in the local gay paper.
- Closeted gays and lesbians would not appear in the gay press simply because nobody would know about them.
- Older gays and lesbians are more likely to be closeted than younger generations.
For a detailed analysis of the first obituary study, which is methodologically identical to this latest incarnation, see “Part 8: Effects on Lifespan” from my series, “A Close Look at Paul Cameron’s Medical Consequences of What Homosexuals Do.”
Yes, Cameron is up to his same old tricks again. You can bet that this won’t be the last time we hear from him. And no matter how ridiculous his methodologies may be, he will continue to provide statistical fodder for the anti-gay lobby. But with his latest paper on the “Homosexual Footprint,” he doesn’t have a leg to stand on. This time, as always, his “footprint” is planted firmly in his mouth.
Notes:
1. Cameron, Paul. Press release: “Married gays die 24 years younger.” Christian Newswire (April 5, 2007). Available online at http://www.christiannewswire.com/news/474922698.html.
2. Cameron, Paul. Press release: “Gays dies sooner: Implications for adoption.” Christian Newswire (March 27, 2007). Available online at http://www.christiannewswire.com/news/306142602.html.
3. Cameron, Paul. Press release: “Discrimination doesn’t drive gays to an early grave.” Christian Newswire (March 29, 2007). Available online at http://www.christiannewswire.com/news/468022639.html.
4. Cameron, Paul. Press release: “Homosexuality more dangerous than smoking.” Christian Newswire (April 3, 2007). Available online at http://www.christiannewswire.com/news/180062680.html.
5. Cameron, Paul; Cameron, Kirk. “Federal distortion of homosexual footprint (Ignoring early gay death?)” Paper reputedly presented at the Eastern Psychological Association (Philadelphia: March 23, 2007). Available online at http://www.lifesite.net/ldn/2007_docs/CameronHomosexualFootprint.pdf.
6. Cameron, Paul. Press release: “Gays dies sooner: Implications for adoption.” Christian Newswire (March 27, 2007). Available online at http://www.christiannewswire.com/news/306142602.html.
7. Eastern Psychological Association. Program Calendar, Social: Gender, Ethnicity, Sex, Relationships. (March 23, 2007). Available online at http://www.easternpsychological.org/index.php?pg=programcalendar&subsection=sessiondetail&id=18.
8. Cameron, Paul; Playfair, William L.; Wellum, Stephen. “The lifespan of homosexuals.” Paper presented at the Eastern Psychological Association (Washington: April 17, 1993).
Cameron, Paul; Playfair, William L.; Wellum, Stephen. “The longevity of homosexuals: Before and after the AIDS epidemic.” Omega 29, no. 3 (1994): 249-272.
Cameron, Paul; Cameron, Kirk; Playfair, William L. “Does homosexual activity shorten life?” Psychological Reports 83, no. 3 (December 1998): 847-866.
Cameron, Paul. “Homosexual partnerships and homosexual longevity: A replication.” Psychological Reports 91, no. 2 (October 2002): 671-678.
Cameron, Paul. “Gay obituaries closely track officially reported deaths from AIDS.” Psychological Reports 96, no. 3 (June 2005): 693-697.
Cameron, Paul; Landess, Thomas; Cameron, Kirk. “Homosexual sex as harmful as drug abuse, prostitution, or smoking.” Psychological Reports 96, no. 3 (June 2005): 915-961.
9. Williams, Armstrong. “Same-Sex Marriage?????” Web site, The Hill’s Pundits Blog (March 29, 2007): http://pundits.thehill.com/2007/03/29/same-sex-marriage/ (accessed April 8, 2007).
10. Shankle, Michael D.; Maxwell, Charles A.; Katzman, Esther S.; Landers, Stewart. “An in visible population: Older lesbian, gay, bisexual, and transgender individuals.” Clinical Research and Regulatory Affairs 20, no. 2. (2003): 159-182.
11. Johnson, Michael J.; Jackson, Nick C.; Arnette, J. Kenneth; Koffman, Stephen D. “Gay and lesbian perceptions of discrimination in retirement care facilities.” Journal of Homosexuality 49, no. 2 (2005): 83-102. Abstract available at: http://www.ncbi.nlm.nih.gov/entrez/query.fcgi?db=pubmed&cmd=Retrieve&dopt=AbstractPlus&list_uids=16048895.
12. Statistics Canada. “Canadian Community Health Survey.” The Dailey (June 15, 2004): 6-9. Full text vailable online at http://www.statcan.ca:80/Daily/English/040615/d040615b.htm.
13. Statistics Denmark. “IREG1: Entered registered partnerships by sex, age of youngest person and age of oldest person.” Dataset available online at http://www.statbank.dk/statbank5a/SelectVarVal/Define.asp?Maintable=IREG1&PLanguage=1.
14. Eskridge, William N., Jr.; Spedale, Darren R. Gay Marriage: For Better or Worse? What We’ve Learned From The Evidence. (New York: Oxford University Press, 2006): 104.
15. Statistics Denmark. “VIE1: Average age of males and females getting married by age.” Dataset available online at http://www.statbank.dk/statbank5a/SelectVarVal/Define.asp?Maintable=VIE1&PLanguage=1.
16. Statistics Denmark. “BEF1A: Population 1 January by region, age, sex, marital status (closed serie).” Dataset available online at http://www.statbank.dk/statbank5a/SelectVarVal/Define.asp?Maintable=BEF1A&PLanguage=1. Figures represent “ever-married” (currently married, separated, divorced and widowed) and “ever-partnered” (currently partnered, separated, and terminated by death of a partner).
17. Statistics Norway. Statistical Yearbook of Norway, 1996 (Oslo: 1996): Table 37: “Population by sex, age and marital status. 1 January 1995.” Available online at http://www.ssb.no/english/yearbook/96/tables/te37.html. Figures represent “ever-married” (currently married, separated, divorced and widowed) and “ever-partnered” (currently partnered, separated, and terminated by death of a partner).
Statistics Norway. Statistical Yearbook of Norway, 2000 (Oslo: 2000): Table 63: “Population, by sex, age and marital status. 1 January 2000.” Available online at http://www.ssb.no/english/yearbook/2000/tab/t-020110-063.html. Figures represent “ever-married” (currently married, separated, divorced and widowed) and “ever-partnered” (currently partnered, separated, and terminated by death of a partner).
Statistics Norway. Statistical Yearbook of Norway, 2005 (Oslo: 2005): Table 57: “Population, by sex, age and marital status. 1 January 2005.” Available online at http://www.ssb.no/english/yearbook/2005/tab/tab-057.html. Figures represent “ever-married” (currently married, separated, divorced and widowed) and “ever-partnered” (currently partnered, separated, and terminated by death of a partner).
18. The International Lesbian and Gay Association. “World Legal Survey, Denmark.” Web site (July 21, 2000): http://www.ilga.info/Information/Legal_survey/europe/denmark.htm (accessed April 8, 2007).
19. Eskridge, William N., Jr.; Spedale, Darren R. Gay Marriage: For Better or Worse? What We’ve Learned From The Evidence. (New York: Oxford University Press, 2006): 105-109.
20. Cameron, Paul; Playfair, William L.; Wellum, Stephen. “The lifespan of homosexuals.” Paper presented at the Eastern Psychological Association (Washington: April 17, 1993).